Cardano Pips Bitcoin and Ethereum in Decentralization Rankings, All Eyes on Staking Flows and Institutional Signals

Cardano has jumped ahead of larger rivals in a metric that tries to quantify who really holds the keys to a network’s block production. Fresh findings from the Edinburgh Decentralization Index, published through Chainspect, show Cardano with a Nakamoto coefficient of 21, versus 3 for Bitcoin and 2 for Ethereum, implying more independent entities are needed to coordinate control of Cardano than on those older chains. Several outlets summarized the report’s headline figures, placing Cardano near the global leaders and just behind Polkadot and Moonbeam in decentralization ranks. The metric is not a price target, yet it arrives while ADA trades around the mid-sixty-cent range and tests support that traders have watched for months.
- EDI’s Signal: Cardano’s Validator Distribution Outpaces Larger Rivals
- Cardano’s Consensus: Delegation at Scale Without Classic DPoS Voting
- Price Context: ADA Lingers Near Support as Traders Test the Narrative
- For Traders: How to Convert a Decentralization Lead into Positioning
- Comparative View: What the Coefficient Tries to Capture
- The Market and the News: What Investors Should Watch
- Validator concentration risk:
- Staking participation and churn:
- Institutional tooling:
- Cross-chain flows:
- Price versus activity:
- Conclusion
- Frequently Asked Questions About Cardano’s Decentralization
- How reliable is the Nakamoto coefficient as a decentralization measure?
- Why do outlets compare Cardano with Polkadot and Moonbeam here?
- Can higher decentralization translate into price gains?
- What is the core risk to the EDI narrative?
- Glossary of Key Terms
Investors are now asking a simple question: Can Cardano’s wide network of validators lead to more stable staking, stronger institutional interest, and consistent growth on the blockchain? The answer involves operations as much as narratives. Cardano’s consensus Delegated Proof of Stake helps explain the higher coefficient in the new EDI scoring. Across the broader market, DPoS networks like Polkadot and other delegate-elected systems remain relevant because their governance and fast confirmation often appeal to institutions that prize throughput and auditability. In that context, DPoS shows up as a positive reference point for how elected or delegated validators can raise performance and accountability, even as Cardano’s own architecture is distinct.
ALSO READ: XDC Network Unveils $10M “Surge”, Brings Real-Time Transparency to DeFi
EDI’s Signal: Cardano’s Validator Distribution Outpaces Larger Rivals
The Nakamoto coefficient is a simple framing. It estimates the minimum number of independent actors who would need to collude to disrupt normal operations. A higher number suggests power is less concentrated. Educational primers describe it as a quick way to compare decentralization between systems, despite the metric’s limits and the nuance it compresses .
Chainspect’s latest readout gave Cardano a 21. Bitcoin and Ethereum landed at 3 and 2. Published summaries also note that Cardano sits just behind Polkadot and Moonbeam in the same framework, which matters because both have long promoted performance through either parachain coordination or elected validator sets.
In practice, the EDI findings imply that Cardano’s delegated stake-pool model distributes block production across more independent entities than the mining and liquid-staking landscapes on Bitcoin and Ethereum right now. The University of Edinburgh’s dashboard provides historical views of block-production distribution across chains, which illustrates how shifts in mining pools or stake consolidation can change these scores over time.
Market participants do not buy a coefficient; they buy execution. Still, large funds and crypto-native treasuries have spent the past two years pressuring projects to document validator distribution and concentration risk. A larger coefficient gives those counterparties a simple line in a memo when they justify custodial decisions or network selection. For Cardano, that is a useful credential to carry into year-end conversations about where to route stable assets, where to stake with low perceived capture risk, and where to pilot enterprise proofs of concept.
Cardano’s Consensus: Delegation at Scale Without Classic DPoS Voting
One point needs clarity because headlines can blur definitions. Cardano uses classic Delegated Proof of Stake. The network runs Ouroboros proof-of-stake and relies on delegation to stake pools for block production. Token holders delegate ADA to pools, pools run nodes, and the protocol selects slot leaders based on stake and randomness. There is no fixed, elected set of a small number of block producers, which is a hallmark of DPoS designs. Cardano’s model is closer to an open set of many stake pools that anyone can delegate into, which can support higher validator diversity when pools remain economically viable.
That distinction helps interpret the decentralization result. The EDI comparison suggests that delegation across a broad pool map can increase the number of independent entities needed to collude, while still keeping operational complexity manageable for users. It also explains why networks that use DPoS or elected-validator variants, such as those that rotate a limited set of block producers, can post strong performance and governance clarity even if their coefficient depends on how wide the elected set really is. In short, DPoS remains a positive reference for institutional comfort on speed and predictability, and Cardano’s delegated PoS architecture is delivering a similar comfort on distribution, albeit by different means.
ALSO READ: Sui ETF Back in Limelight as Cboe Awaits SEC Decision on Canary ETF
Price Context: ADA Lingers Near Support as Traders Test the Narrative
The decentralization story lands into a mixed tape for ADA. Price sits near the mid-sixty-cent area, a zone that traders have treated as a pivot through several cycles this year. Intra-day commentary points to $0.62–$0.63 as a local demand band and $0.60 as a round-number support that buyers defended multiple times, while $0.58 is the deeper line that bulls prefer not to test. Resistance clusters near $0.70–$0.77 where key moving averages have converged. A clean push above that band would put $0.85–$0.90 in view, with the psychological $1.10 marker further out if momentum cooperates. Real-time dashboards outline the same levels with minor variations as liquidity shifts.
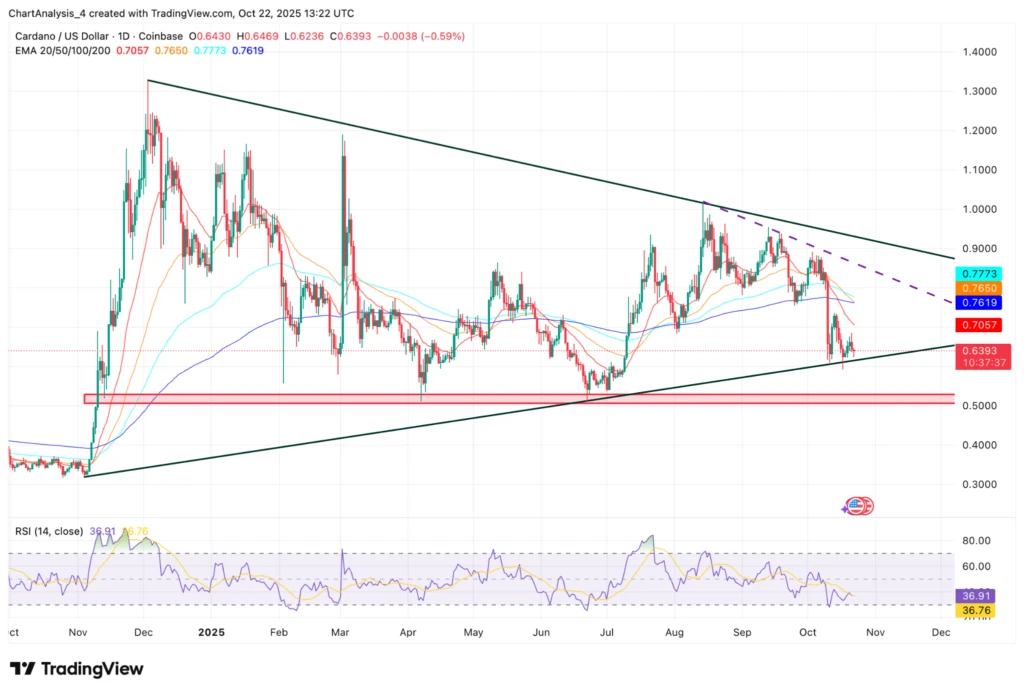
Cardano Price Prediction (Source: TradingView)
The technical picture, by itself, does not validate causal links from decentralization to price. It does, however, set triggers. If staking participation rises and on-chain activity ticks up in the next few weeks, traders will likely tie that to the EDI narrative and try to front-run a break toward the upper band. If activity stalls and price closes below $0.60 for several sessions, the market will infer that validator distribution alone is not enough to pull new capital off the sidelines.
For Traders: How to Convert a Decentralization Lead into Positioning
The next steps will not be decided by one chart. They will be decided by whether Cardano’s distribution advantage shows up in three measurable places.
First, staking and validator health. A climb in stake participation rate, a stable or expanding set of viable stake pools, and limited dominance by a few entities would reinforce the EDI message. Exchange and wallet reports can confirm these trends.
Second, on-chain activity. If decentralized apps post higher user counts, if stablecoin flows begin to favor Cardano rails, or if NFT and identity projects revive, the market will view the coefficient as a leading signal rather than trivia.
Third, institutional posture. If large custodians cite Cardano’s distribution when they expand services, or if enterprise pilots name the network for settlement trials, the coefficient will feel less like a number and more like a checklist item that teams used to unlock approvals.
In the background, traders should remember that decentralization metrics change. Mining pools consolidate and split. Liquid-staking providers gain or lose share. Even networks with DPoS or elected validators adapt their sets as participation ebbs and flows. The EDI dashboard tracks such dynamics through time.
ALSO READ: TRON Staking Goes Live on Ledger Live, Self-Custody Rewards Finally One Tap Away
Comparative View: What the Coefficient Tries to Capture
To ground the discussion in a simple frame, the table below summarizes what the Nakamoto coefficient claims to measure and how Cardano’s reported score compares with reported or summarized figures from the current news cycle. Independent primers explain the definition, while Chainspect’s latest roundup provided the headline numbers.
| Item | Description |
| Nakamoto coefficient definition | Minimum number of independent entities needed to collude to disrupt the network |
| Cardano coefficient | Chainspect’s reported value in the latest EDI summary |
| Bitcoin coefficient | Chainspect’s reported value in the same summary |
| Ethereum coefficient | Chainspect’s reported value in the same summary |
| EDI position for Cardano | Near the top, behind Polkadot and Moonbeam |
| Cardano consensus | Ouroboros PoS with stake delegation to many pools, not classic DPoS |
| Price context | ADA near the mid-sixty-cent area, key bands at 0.60 support and 0.70–0.77 resistance |
The Market and the News: What Investors Should Watch
The EDI score is a starting point for diligence, not an endpoint. Investors can structure the next month around five watch items.
Validator concentration risk:
If a handful of stake pools begin to dominate, the coefficient could slip. If the long tail grows and remains profitable, Cardano’s decentralization argument gets stronger.
Staking participation and churn:
Rising stake rates and stable delegation patterns suggest durable confidence. Sharp churn into a few pools would argue the opposite.
Institutional tooling:
Custodians and prime brokers tend to follow demand, not lead it. New listings, staking support, and compliance notes that call out validator distribution would be concrete signals that the EDI data influenced roadmaps.
Cross-chain flows:
DPoS networks keep attracting enterprise pilots that value speed and transparency. If Cardano secures those pilots without moving to an elected-validator model, it strengthens the case that delegated pools plus Ouroboros can deliver both distribution and operational clarity.
Price versus activity:
A clean break above the $0.70–$0.77 cluster on rising on-chain activity would tell traders that fundamentals are finally pulling price. Failures at that band or closes under $0.60 would warn that more time is needed.
Conclusion
Cardano’s reported lead in decentralization metrics gives investors a cleaner thesis to test. The EDI data indicates that more independent entities would be required to disrupt Cardano than to disrupt Bitcoin or Ethereum. The network achieves this high decentralization through its unique Delegated Proof of Stake (DPoS) consensus mechanism, known as Ouroboros. This model, which involves delegation of stake to a large network of independent stake pools, captures some of the institutional comfort that secure, enterprise-grade chains market.
The market will now ask for proof in staking participation, validator health, and on-chain growth. If those trends strengthen, ADA has a stronger case to challenge resistance between $0.70 and $0.77 and to reprice in step with usage. If they stall, price will likely respect current ranges and treat the coefficient as an academic win. Either way, the decentralization discussion has shifted from slogans to measurable distribution, which is where long-only capital prefers to do its work.
Frequently Asked Questions About Cardano’s Decentralization
How reliable is the Nakamoto coefficient as a decentralization measure?
It is a useful snapshot, not a full portrait. It estimates how many independent entities would need to coordinate to disrupt block production. It ignores other layers like clients, governance, and infrastructure. Treat it as one input alongside broader diligence.
Why do outlets compare Cardano with Polkadot and Moonbeam here?
Because the EDI report and summaries placed Cardano near those networks in decentralization ranks. Both Polkadot and Moonbeam promote coordinated validator sets and governance, which institutions often view as operationally legible.
Can higher decentralization translate into price gains?
Only if it attracts usage, staking, and institutional flows. If the new score coincides with rising on-chain activity and cleaner tooling, buyers have reasons to push ADA through resistance. If activity stays flat, price will likely respect the existing range.
What is the core risk to the EDI narrative?
Metrics can change quickly if stake consolidates, if exchange staking alters distribution, or if a few entities gather outsize influence. Investors should monitor pool share data and custody disclosures over time.
Glossary of Key Terms
- Nakamoto coefficient: The estimated minimum number of independent entities needed to collude to disrupt a network’s normal operation.
- EDi/Chainspect: A research initiative and dashboard associated with the University of Edinburgh that analyzes decentralization across chains.
- Proof-of-stake (PoS): A consensus model where validators propose and attest to blocks based on staked tokens.
- Delegated Proof of Stake (DPoS): A consensus family where token holders elect a limited set of block producers, offering speed and governance clarity.
- Delegation: Assigning stake to a pool or validator to participate in consensus and earn rewards.
- Stake pool: An entity that aggregates delegated stake to run validator nodes on Cardano.
- Validator concentration: The degree to which a small number of entities control block production.
- Finality: The point at which transactions are considered irreversible.
- Support and resistance: Price levels where demand or supply has repeatedly changed the direction of an asset.
- On-chain activity: Usage metrics such as transactions, active addresses, DeFi volumes, and NFT minting.